> ## Documentation Index
> Fetch the complete documentation index at: https://docs.stagehand.dev/llms.txt
> Use this file to discover all available pages before exploring further.
# Observability
> Track Stagehand automation with session visibility and analytics
Watch a run as it happens, replay it afterwards, and read back its token usage. This page covers session monitoring and resource usage on both Browserbase and local browsers.
## Browserbase session monitoring
On Browserbase, the API and dashboard give you live views, recordings, and session metadata.
### Live session visibility
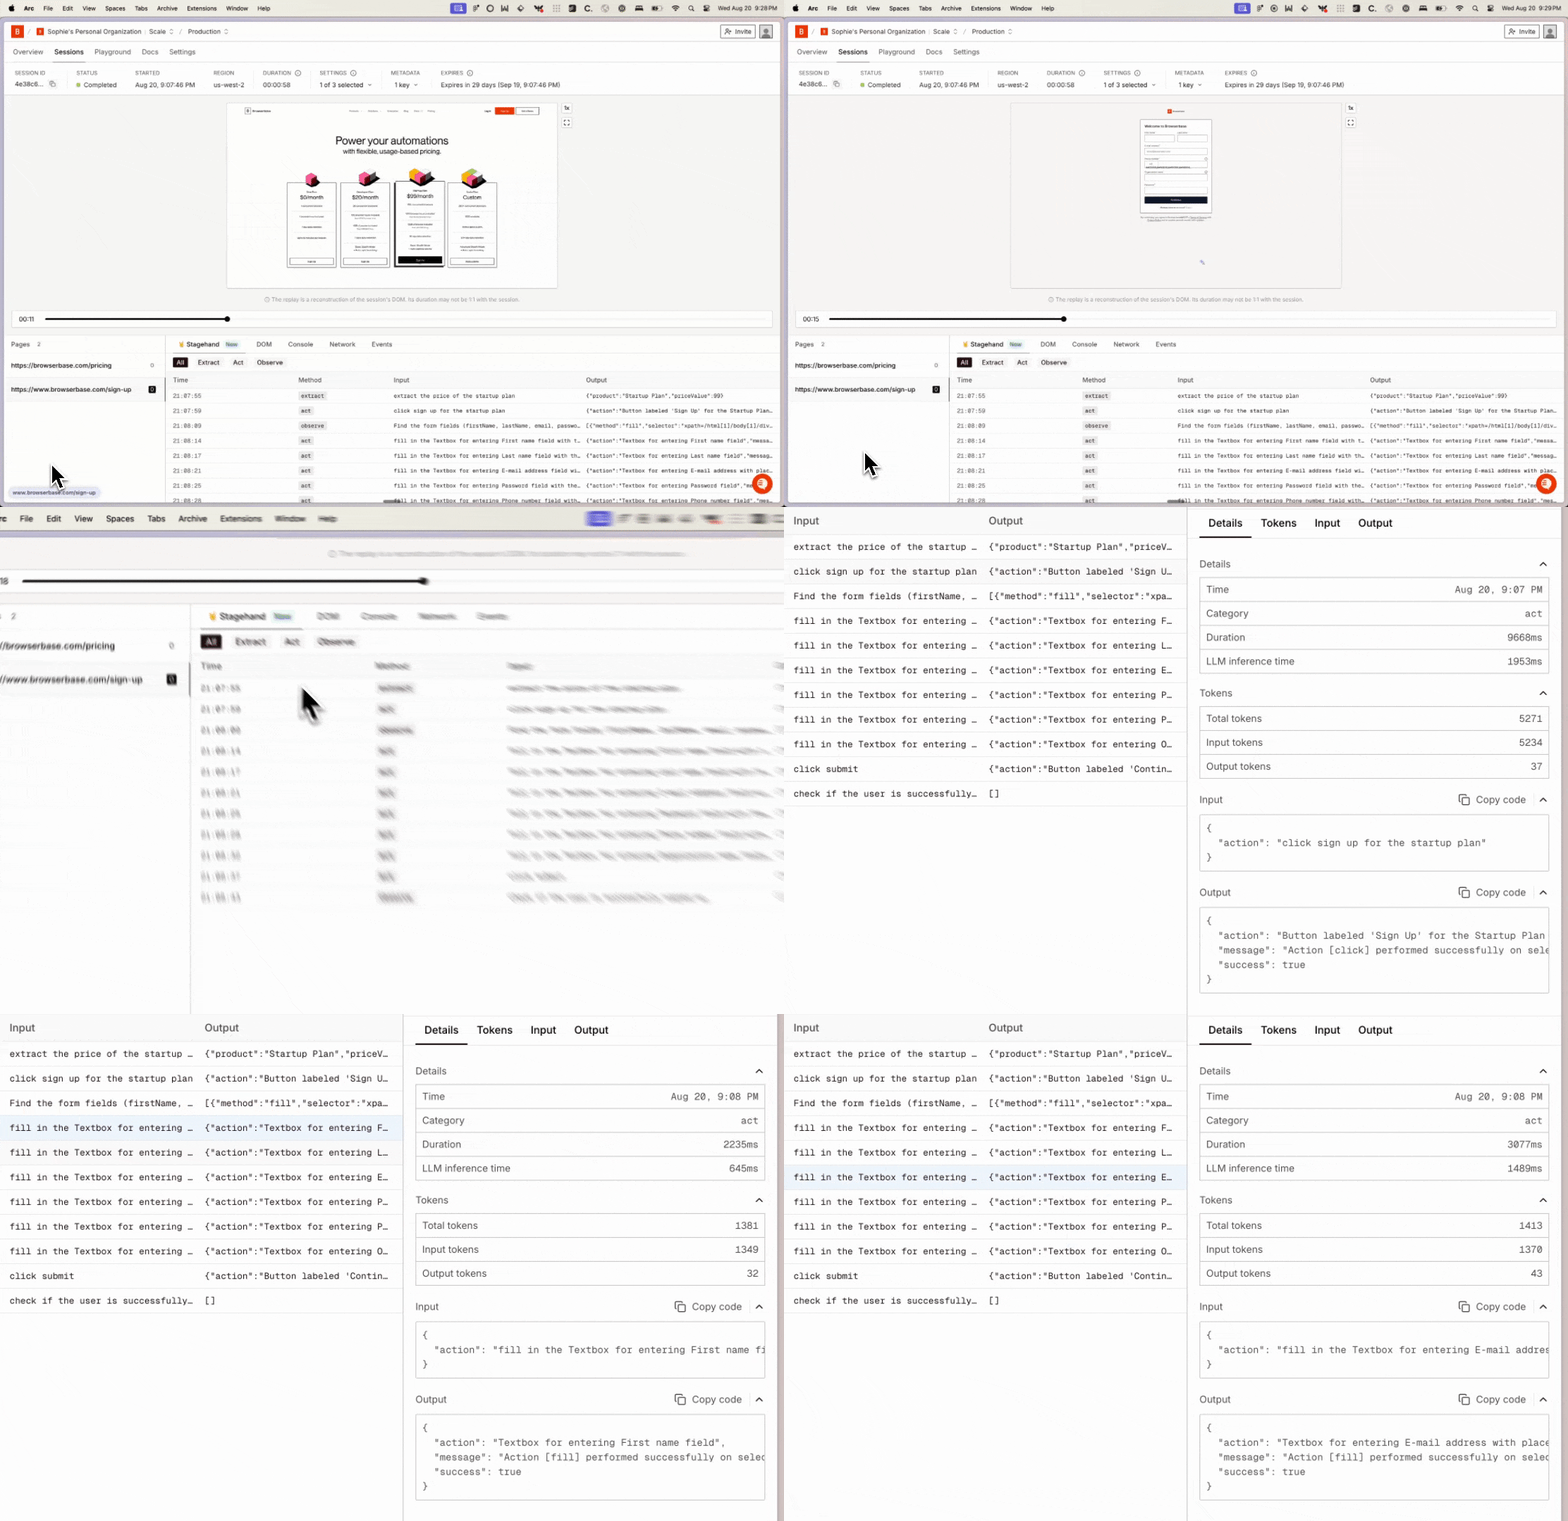
Browserbase provides real-time visibility into your automation sessions:
**Session dashboard features**
* Real-time browser screen recording and replay
* Network request monitoring with detailed timing
* JavaScript console logs and error tracking
* CPU and memory usage metrics
* Session status and duration tracking
**Session management & API access**
```typescript theme={null}
import { Browserbase } from "@browserbasehq/sdk";
import { browserbase as stagehandBrowserbase, Stagehand } from "@browserbasehq/stagehand";
const bb = new Browserbase({
apiKey: process.env.BROWSERBASE_API_KEY,
});
// Create the session yourself so you hold the session ID
const session = await bb.sessions.create({
projectId: process.env.BROWSERBASE_PROJECT_ID,
});
const browser = await stagehandBrowserbase.connect({
apiKey: process.env.BROWSERBASE_API_KEY,
sessionId: session.id,
});
const stagehand = await Stagehand.create({ browser });
const sessionInfo = await bb.sessions.retrieve(session.id);
console.log("Session status:", sessionInfo.status);
console.log("Session region:", sessionInfo.region);
console.log("CPU usage:", sessionInfo.avgCpuUsage);
console.log("Memory usage:", sessionInfo.memoryUsage);
console.log("Proxy bytes:", sessionInfo.proxyBytes);
```
```python theme={null}
import os
from browserbase import Browserbase
from stagehand import Stagehand
from stagehand import browserbase as stagehand_browserbase
bb = Browserbase(api_key=os.environ["BROWSERBASE_API_KEY"])
# Create the session yourself so you hold the session ID
session = bb.sessions.create(
project_id=os.environ["BROWSERBASE_PROJECT_ID"],
)
browser = await stagehand_browserbase.connect(
api_key=os.environ["BROWSERBASE_API_KEY"],
session_id=session.id,
)
stagehand = await Stagehand.create(browser=browser)
session_info = bb.sessions.retrieve(session.id)
print("Session status:", session_info.status)
print("Session region:", session_info.region)
print("CPU usage:", session_info.avg_cpu_usage)
print("Memory usage:", session_info.memory_usage)
print("Proxy bytes:", session_info.proxy_bytes)
```
```go theme={null}
// Create the session with your Browserbase client of choice so you hold the
// session ID, then attach Stagehand to it.
session, err := createBrowserbaseSession(ctx)
if err != nil {
return err
}
browser, err := stagehand.ConnectBrowserbase(ctx, stagehand.BrowserbaseConnectOptions{
APIKey: os.Getenv("BROWSERBASE_API_KEY"),
SessionID: session.ID,
})
if err != nil {
return err
}
client, err := stagehand.Create(ctx, stagehand.CreateOptions{
Browser: browser,
})
if err != nil {
return err
}
defer func() { err = errors.Join(err, client.Close(ctx)) }()
info, err := retrieveBrowserbaseSession(ctx, session.ID)
if err != nil {
return err
}
fmt.Println("Session status:", info.Status)
fmt.Println("Session region:", info.Region)
fmt.Println("CPU usage:", info.AvgCPUUsage)
fmt.Println("Memory usage:", info.MemoryUsage)
fmt.Println("Proxy bytes:", info.ProxyBytes)
```
### Session analytics & insights
Monitor live session status, resource usage, and geographic distribution. Scale and manage concurrent sessions with real-time insights.
Review complete session recordings with frame-by-frame playback. Analyze network requests and debug browser interactions visually.
Programmatically access session data, automate lifecycle management, and integrate with monitoring systems through the Browserbase API.
Track resource consumption, session duration, and API usage. Get detailed breakdowns of costs and utilization across your automation.
### Session monitoring & filtering
Query and monitor sessions by status and metadata:
```typescript theme={null}
import { Browserbase } from "@browserbasehq/sdk";
const browserbase = new Browserbase({
apiKey: process.env.BROWSERBASE_API_KEY,
});
// The fields this example reads off a Browserbase session. Resource counters
// are optional because older API versions omit them.
type BrowserbaseSession = {
id: string;
status: string;
startedAt: string;
endedAt?: string;
region: string;
proxyBytes: number;
avgCpuUsage?: number;
memoryUsage?: number;
userMetadata?: Record;
};
// List sessions with filtering
async function getFilteredSessions() {
const sessions = await browserbase.sessions.list({
status: "RUNNING",
});
return sessions.map((session: BrowserbaseSession) => ({
id: session.id,
status: session.status, // RUNNING, COMPLETED, ERROR, TIMED_OUT
startedAt: session.startedAt,
endedAt: session.endedAt,
region: session.region,
avgCpuUsage: session.avgCpuUsage,
memoryUsage: session.memoryUsage,
proxyBytes: session.proxyBytes,
userMetadata: session.userMetadata,
}));
}
// Query sessions by metadata
async function querySessionsByMetadata(query: string) {
const sessions = await browserbase.sessions.list({
q: query,
});
return sessions;
}
```
```python theme={null}
import os
from browserbase import Browserbase
browserbase = Browserbase(api_key=os.environ["BROWSERBASE_API_KEY"])
# List sessions with filtering
def get_filtered_sessions():
sessions = browserbase.sessions.list(status="RUNNING")
return [
{
"id": session.id,
"status": session.status, # RUNNING, COMPLETED, ERROR, TIMED_OUT
"started_at": session.started_at,
"ended_at": session.ended_at,
"region": session.region,
"avg_cpu_usage": session.avg_cpu_usage,
"memory_usage": session.memory_usage,
"proxy_bytes": session.proxy_bytes,
"user_metadata": session.user_metadata,
}
for session in sessions
]
# Query sessions by metadata
def query_sessions_by_metadata(query: str):
return browserbase.sessions.list(q=query)
```
```go theme={null}
type sessionSummary struct {
ID string
Status string // RUNNING, COMPLETED, ERROR, TIMED_OUT
StartedAt time.Time
EndedAt time.Time
Region string
AvgCPUUsage float64
MemoryUsage float64
ProxyBytes int64
UserMetadata map[string]any
}
// List sessions with filtering
func getFilteredSessions(ctx context.Context) ([]sessionSummary, error) {
sessions, err := listBrowserbaseSessions(ctx, listOptions{Status: "RUNNING"})
if err != nil {
return nil, err
}
summaries := make([]sessionSummary, 0, len(sessions))
for _, session := range sessions {
summaries = append(summaries, sessionSummary{
ID: session.ID,
Status: session.Status,
StartedAt: session.StartedAt,
EndedAt: session.EndedAt,
Region: session.Region,
AvgCPUUsage: session.AvgCPUUsage,
MemoryUsage: session.MemoryUsage,
ProxyBytes: session.ProxyBytes,
UserMetadata: session.UserMetadata,
})
}
return summaries, nil
}
// Query sessions by metadata
func querySessionsByMetadata(ctx context.Context, query string) ([]browserbaseSession, error) {
return listBrowserbaseSessions(ctx, listOptions{Query: query})
}
```
Tag every session with `userMetadata` on `browserbase.launch()` so you can slice these queries by workflow, customer, or deployment.
## Local environment monitoring
For local development, Stagehand provides performance monitoring and resource tracking capabilities directly on your machine.
### Performance tracking
```typescript theme={null}
import { localBrowser, Stagehand } from "@browserbasehq/stagehand";
import { z } from "zod/v4";
const DataSchema = z.object({ title: z.string() });
const browser = await localBrowser.launch();
const stagehand = await Stagehand.create({
browser,
logging: { level: "info" }, // Monitor performance without debug noise
});
// Track local automation metrics
const startTime = Date.now();
const initialMetrics = await stagehand.metrics();
// ... perform automation tasks
const [page] = await browser.context.pages();
await page.goto("https://example.com");
await stagehand.act("click button");
await stagehand.extract("get data", DataSchema);
const finalMetrics = await stagehand.metrics();
const executionTime = Date.now() - startTime;
// Metrics are cumulative for the session, so subtract the baseline
const tokensUsed =
finalMetrics.totalPromptTokens + finalMetrics.totalCompletionTokens -
(initialMetrics.totalPromptTokens + initialMetrics.totalCompletionTokens);
console.log("Local Performance Summary:", {
executionTime: `${executionTime}ms`,
tokensUsed,
totalInferenceTime: `${finalMetrics.totalInferenceTimeMs}ms`,
tokensPerSecond: (tokensUsed / (executionTime / 1000)).toFixed(2),
});
```
```python theme={null}
from time import perf_counter
from pydantic import BaseModel
from stagehand import Stagehand, local_browser
class Data(BaseModel):
title: str
browser = await local_browser.launch()
stagehand = await Stagehand.create(
browser=browser,
logging={"level": "info"}, # Monitor without debug noise
)
# Track local automation metrics
start_time = perf_counter()
initial_metrics = await stagehand.metrics()
# ... perform automation tasks
page = (await browser.context.pages())[0]
await page.goto("https://example.com")
await stagehand.act("click button")
await stagehand.extract("get data", Data)
final_metrics = await stagehand.metrics()
execution_time = (perf_counter() - start_time) * 1000
# Metrics are cumulative for the session, so subtract the baseline
tokens_used = (
final_metrics.total_prompt_tokens
+ final_metrics.total_completion_tokens
- initial_metrics.total_prompt_tokens
- initial_metrics.total_completion_tokens
)
print("Local Performance Summary:", {
"execution_time": f"{execution_time:.0f}ms",
"tokens_used": tokens_used,
"total_inference_time": f"{final_metrics.total_inference_time_ms}ms",
"tokens_per_second": f"{tokens_used / (execution_time / 1000):.2f}",
})
```
```go theme={null}
type data struct {
Title string `json:"title"`
}
browser, err := stagehand.LaunchLocalBrowser(ctx, &stagehand.LocalBrowserLaunchOptions{})
if err != nil {
return err
}
client, err := stagehand.Create(ctx, stagehand.CreateOptions{
Browser: browser,
Logging: &stagehand.StagehandClientLoggingConfig{
Level: stagehand.StagehandClientLogLevelInfo, // Monitor without debug noise
},
})
if err != nil {
return err
}
// Track local automation metrics
startTime := time.Now()
initialMetrics, err := client.Metrics(ctx)
if err != nil {
return err
}
// ... perform automation tasks
browserContext, err := browser.Context()
if err != nil {
return err
}
pages, err := browserContext.Pages(ctx)
if err != nil {
return err
}
if len(pages) == 0 {
return errors.New("Stagehand initialized without an active page")
}
page := pages[0]
if _, err := page.Goto(ctx, "https://example.com", nil); err != nil {
return err
}
if _, err := client.Act(ctx, stagehand.ActInstruction("click button"), nil); err != nil {
return err
}
if _, err := stagehand.Extract[data](ctx, client, "get data", nil); err != nil {
return err
}
finalMetrics, err := client.Metrics(ctx)
if err != nil {
return err
}
executionTime := time.Since(startTime)
// Metrics are cumulative for the session, so subtract the baseline
tokensUsed := (finalMetrics.TotalPromptTokens + finalMetrics.TotalCompletionTokens) -
(initialMetrics.TotalPromptTokens + initialMetrics.TotalCompletionTokens)
fmt.Printf(
"Local Performance Summary: executionTime=%dms tokensUsed=%.0f totalInferenceTime=%.0fms tokensPerSecond=%.2f\n",
executionTime.Milliseconds(),
tokensUsed,
finalMetrics.TotalInferenceTimeMs,
tokensUsed/executionTime.Seconds(),
)
```
## Resource usage monitoring
When running locally, monitor system resource usage and browser performance:
```typescript theme={null}
import * as os from "node:os";
import { browserbase, Stagehand } from "@browserbasehq/stagehand";
class LocalResourceMonitor {
private cpuUsage: number[] = [];
private memoryUsage: number[] = [];
startMonitoring() {
const interval = setInterval(() => {
// Track system resources
const memUsage = process.memoryUsage();
this.memoryUsage.push(memUsage.heapUsed / 1024 / 1024); // MB
// Track CPU (simplified)
const loadAvg = os.loadavg()[0];
this.cpuUsage.push(loadAvg);
}, 1000);
return interval;
}
getResourceSummary() {
return {
avgMemoryUsage: this.memoryUsage.reduce((a, b) => a + b, 0) / this.memoryUsage.length,
peakMemoryUsage: Math.max(...this.memoryUsage),
avgCpuLoad: this.cpuUsage.reduce((a, b) => a + b, 0) / this.cpuUsage.length,
totalDataPoints: this.cpuUsage.length,
};
}
}
const monitor = new LocalResourceMonitor();
const interval = monitor.startMonitoring();
const browser = await localBrowser.launch();
const stagehand = await Stagehand.create({ browser });
// ... run automation
clearInterval(interval);
console.log("Resource Usage:", monitor.getResourceSummary());
```
```python theme={null}
import asyncio
import os
import resource
from stagehand import Stagehand, local_browser
class LocalResourceMonitor:
def __init__(self) -> None:
self.cpu_usage: list[float] = []
self.memory_usage: list[float] = []
self._task: asyncio.Task | None = None
def start_monitoring(self) -> asyncio.Task:
async def sample() -> None:
while True:
# Track system resources
peak_kb = resource.getrusage(resource.RUSAGE_SELF).ru_maxrss
self.memory_usage.append(peak_kb / 1024) # MB
# Track CPU (simplified)
self.cpu_usage.append(os.getloadavg()[0])
await asyncio.sleep(1)
self._task = asyncio.create_task(sample())
return self._task
def get_resource_summary(self) -> dict[str, float]:
return {
"avg_memory_usage": sum(self.memory_usage) / len(self.memory_usage),
"peak_memory_usage": max(self.memory_usage),
"avg_cpu_load": sum(self.cpu_usage) / len(self.cpu_usage),
"total_data_points": len(self.cpu_usage),
}
monitor = LocalResourceMonitor()
task = monitor.start_monitoring()
browser = await local_browser.launch()
stagehand = await Stagehand.create(browser=browser)
# ... run automation
task.cancel()
print("Resource Usage:", monitor.get_resource_summary())
```
```go theme={null}
type localResourceMonitor struct {
mu sync.Mutex
cpuUsage []float64
memoryUsage []float64
}
func (m *localResourceMonitor) startMonitoring(ctx context.Context) {
go func() {
ticker := time.NewTicker(time.Second)
defer ticker.Stop()
for {
select {
case <-ctx.Done():
return
case <-ticker.C:
var stats runtime.MemStats
runtime.ReadMemStats(&stats)
m.mu.Lock()
// Track system resources
m.memoryUsage = append(m.memoryUsage, float64(stats.HeapAlloc)/1024/1024) // MB
// Track CPU (simplified)
m.cpuUsage = append(m.cpuUsage, float64(runtime.NumGoroutine()))
m.mu.Unlock()
}
}
}()
}
func (m *localResourceMonitor) getResourceSummary() map[string]float64 {
m.mu.Lock()
defer m.mu.Unlock()
return map[string]float64{
"avgMemoryUsage": average(m.memoryUsage),
"peakMemoryUsage": maxOf(m.memoryUsage),
"avgCpuLoad": average(m.cpuUsage),
"totalDataPoints": float64(len(m.cpuUsage)),
}
}
monitorCtx, stopMonitor := context.WithCancel(ctx)
monitor := &localResourceMonitor{}
monitor.startMonitoring(monitorCtx)
browser, err := stagehand.LaunchLocalBrowser(ctx, &stagehand.LocalBrowserLaunchOptions{})
if err != nil {
return err
}
client, err := stagehand.Create(ctx, stagehand.CreateOptions{Browser: browser})
// ... run automation
stopMonitor()
fmt.Println("Resource Usage:", monitor.getResourceSummary())
```
Monitor token usage, costs, and speed. Set up automated alerting for critical failures. Implement cost tracking across different environments. Use session analytics to optimize automation workflows.
## Real-time metrics & monitoring
### Basic usage tracking
Monitor your automation's resource usage in real-time by calling the metrics method:
```typescript theme={null}
import { browserbase, Stagehand } from "@browserbasehq/stagehand";
import { z } from "zod/v4";
const UserSchema = z.object({ name: z.string(), email: z.string() });
const browser = await browserbase.launch({
apiKey: process.env.BROWSERBASE_API_KEY,
});
const stagehand = await Stagehand.create({ browser });
// Metrics are fetched from the runtime, so the call is awaited
const metrics = await stagehand.metrics();
console.log(metrics);
// Monitor during automation
const startTime = Date.now();
const initialMetrics = await stagehand.metrics();
// ... perform automation tasks
const [page] = await browser.context.pages();
await page.goto("https://example.com");
await stagehand.act("click the login button");
const { data } = await stagehand.extract("extract user info", UserSchema);
console.log(`Extracted ${data.name} <${data.email}>`);
const finalMetrics = await stagehand.metrics();
const executionTime = Date.now() - startTime;
// Metrics are cumulative for the session, so subtract the baseline
const tokensUsed =
finalMetrics.totalPromptTokens + finalMetrics.totalCompletionTokens -
(initialMetrics.totalPromptTokens + initialMetrics.totalCompletionTokens);
console.log("Automation Summary:", {
tokensUsed,
executionTime: `${executionTime}ms`,
avgInferenceTime: `${finalMetrics.totalInferenceTimeMs / 3}ms`,
});
```
```python theme={null}
import os
from time import perf_counter
from pydantic import BaseModel
from stagehand import Stagehand, browserbase
class User(BaseModel):
name: str
email: str
browser = await browserbase.launch(
api_key=os.environ["BROWSERBASE_API_KEY"],
)
stagehand = await Stagehand.create(browser=browser)
# Metrics are fetched from the runtime, so the call is awaited
metrics = await stagehand.metrics()
print(metrics)
# Monitor during automation
start_time = perf_counter()
initial_metrics = await stagehand.metrics()
# ... perform automation tasks
page = (await browser.context.pages())[0]
await page.goto("https://example.com")
await stagehand.act("click the login button")
data = (await stagehand.extract("extract user info", User)).data
print(f"Extracted {data.name} <{data.email}>")
final_metrics = await stagehand.metrics()
execution_time = (perf_counter() - start_time) * 1000
# Metrics are cumulative for the session, so subtract the baseline
tokens_used = (
final_metrics.total_prompt_tokens
+ final_metrics.total_completion_tokens
- initial_metrics.total_prompt_tokens
- initial_metrics.total_completion_tokens
)
print("Automation Summary:", {
"tokens_used": tokens_used,
"execution_time": f"{execution_time:.0f}ms",
"avg_inference_time": f"{final_metrics.total_inference_time_ms / 3}ms",
})
```
```go theme={null}
type user struct {
Name string `json:"name"`
Email string `json:"email"`
}
apiKey := os.Getenv("BROWSERBASE_API_KEY")
browser, err := stagehand.LaunchBrowserbase(ctx, stagehand.BrowserbaseLaunchOptions{APIKey: apiKey})
if err != nil {
return err
}
client, err := stagehand.Create(ctx, stagehand.CreateOptions{
Browser: browser,
})
if err != nil {
return err
}
// Metrics are fetched from the runtime, so the call takes a context
metrics, err := client.Metrics(ctx)
if err != nil {
return err
}
fmt.Printf("%+v\n", metrics)
// Monitor during automation
startTime := time.Now()
initialMetrics, err := client.Metrics(ctx)
if err != nil {
return err
}
// ... perform automation tasks
browserContext, err := browser.Context()
if err != nil {
return err
}
pages, err := browserContext.Pages(ctx)
if err != nil {
return err
}
if len(pages) == 0 {
return errors.New("Stagehand initialized without an active page")
}
page := pages[0]
if _, err := page.Goto(ctx, "https://example.com", nil); err != nil {
return err
}
if _, err := client.Act(ctx, stagehand.ActInstruction("click the login button"), nil); err != nil {
return err
}
extracted, err := stagehand.Extract[user](ctx, client, "extract user info", nil)
if err != nil {
return err
}
fmt.Printf("Extracted %s <%s>\n", extracted.Data.Name, extracted.Data.Email)
finalMetrics, err := client.Metrics(ctx)
if err != nil {
return err
}
executionTime := time.Since(startTime)
// Metrics are cumulative for the session, so subtract the baseline
tokensUsed := (finalMetrics.TotalPromptTokens + finalMetrics.TotalCompletionTokens) -
(initialMetrics.TotalPromptTokens + initialMetrics.TotalCompletionTokens)
fmt.Printf(
"Automation Summary: tokensUsed=%.0f executionTime=%dms avgInferenceTime=%.0fms\n",
tokensUsed,
executionTime.Milliseconds(),
finalMetrics.TotalInferenceTimeMs/3,
)
```
### Understanding metrics data
The metrics object provides a detailed breakdown by Stagehand operation:
```typescript theme={null}
interface StagehandMetrics {
// Act operation metrics
actPromptTokens: number;
actCompletionTokens: number;
actReasoningTokens: number;
actCachedInputTokens: number;
actInferenceTimeMs: number;
// Extract operation metrics
extractPromptTokens: number;
extractCompletionTokens: number;
extractReasoningTokens: number;
extractCachedInputTokens: number;
extractInferenceTimeMs: number;
// Observe operation metrics
observePromptTokens: number;
observeCompletionTokens: number;
observeReasoningTokens: number;
observeCachedInputTokens: number;
observeInferenceTimeMs: number;
// Cumulative totals
totalPromptTokens: number;
totalCompletionTokens: number;
totalReasoningTokens: number;
totalCachedInputTokens: number;
totalInferenceTimeMs: number;
}
```
```python theme={null}
class StagehandMetrics(BaseModel):
# Act operation metrics
act_prompt_tokens: float
act_completion_tokens: float
act_reasoning_tokens: float
act_cached_input_tokens: float
act_inference_time_ms: float
# Extract operation metrics
extract_prompt_tokens: float
extract_completion_tokens: float
extract_reasoning_tokens: float
extract_cached_input_tokens: float
extract_inference_time_ms: float
# Observe operation metrics
observe_prompt_tokens: float
observe_completion_tokens: float
observe_reasoning_tokens: float
observe_cached_input_tokens: float
observe_inference_time_ms: float
# Cumulative totals
total_prompt_tokens: float
total_completion_tokens: float
total_reasoning_tokens: float
total_cached_input_tokens: float
total_inference_time_ms: float
```
```go theme={null}
type StagehandMetrics struct {
// Act operation metrics
ActPromptTokens float64
ActCompletionTokens float64
ActReasoningTokens float64
ActCachedInputTokens float64
ActInferenceTimeMs float64
// Extract operation metrics
ExtractPromptTokens float64
ExtractCompletionTokens float64
ExtractReasoningTokens float64
ExtractCachedInputTokens float64
ExtractInferenceTimeMs float64
// Observe operation metrics
ObservePromptTokens float64
ObserveCompletionTokens float64
ObserveReasoningTokens float64
ObserveCachedInputTokens float64
ObserveInferenceTimeMs float64
// Cumulative totals
TotalPromptTokens float64
TotalCompletionTokens float64
TotalReasoningTokens float64
TotalCachedInputTokens float64
TotalInferenceTimeMs float64
}
```
**Example metrics output:**
```typescript theme={null}
const metrics = await stagehand.metrics();
console.log(metrics);
// {
// actPromptTokens: 4011,
// actCompletionTokens: 51,
// actReasoningTokens: 12,
// actCachedInputTokens: 0,
// actInferenceTimeMs: 1688,
// extractPromptTokens: 4200,
// extractCompletionTokens: 243,
// extractReasoningTokens: 18,
// extractCachedInputTokens: 0,
// extractInferenceTimeMs: 4297,
// observePromptTokens: 347,
// observeCompletionTokens: 43,
// observeReasoningTokens: 5,
// observeCachedInputTokens: 0,
// observeInferenceTimeMs: 903,
// totalPromptTokens: 8558,
// totalCompletionTokens: 337,
// totalReasoningTokens: 35,
// totalCachedInputTokens: 0,
// totalInferenceTimeMs: 6888
// }
```
```python theme={null}
metrics = await stagehand.metrics()
print(metrics)
# StagehandMetrics(
# act_prompt_tokens=4011,
# act_completion_tokens=51,
# act_reasoning_tokens=12,
# act_cached_input_tokens=0,
# act_inference_time_ms=1688,
# extract_prompt_tokens=4200,
# extract_completion_tokens=243,
# extract_reasoning_tokens=18,
# extract_cached_input_tokens=0,
# extract_inference_time_ms=4297,
# observe_prompt_tokens=347,
# observe_completion_tokens=43,
# observe_reasoning_tokens=5,
# observe_cached_input_tokens=0,
# observe_inference_time_ms=903,
# total_prompt_tokens=8558,
# total_completion_tokens=337,
# total_reasoning_tokens=35,
# total_cached_input_tokens=0,
# total_inference_time_ms=6888,
# )
```
```go theme={null}
metrics, err := client.Metrics(ctx)
if err != nil {
return err
}
fmt.Printf("%+v\n", metrics)
// stagehand.StagehandMetrics{
// ActPromptTokens: 4011,
// ActCompletionTokens: 51,
// ActReasoningTokens: 12,
// ActCachedInputTokens: 0,
// ActInferenceTimeMs: 1688,
// ExtractPromptTokens: 4200,
// ExtractCompletionTokens: 243,
// ExtractReasoningTokens: 18,
// ExtractCachedInputTokens: 0,
// ExtractInferenceTimeMs: 4297,
// ObservePromptTokens: 347,
// ObserveCompletionTokens: 43,
// ObserveReasoningTokens: 5,
// ObserveCachedInputTokens: 0,
// ObserveInferenceTimeMs: 903,
// TotalPromptTokens: 8558,
// TotalCompletionTokens: 337,
// TotalReasoningTokens: 35,
// TotalCachedInputTokens: 0,
// TotalInferenceTimeMs: 6888,
// }
```
Cached input tokens are reported separately so you can see how much of your prompt spend was served from your provider's prompt cache. This is distinct from Stagehand's own [server-side result cache](/v4/best-practices/caching), which avoids the inference call entirely.
### Operation history
Metrics give you the totals. When you want the sequence of what happened, build the timeline yourself from the log callback: every act, observe, and extract emits records with their structured data already attached. There is no history accessor on the `Stagehand` instance.
```typescript theme={null}
// Record each log entry with the time you receive it
const history: Array<{
level: "debug" | "info" | "warn" | "error";
message: string;
data: Record;
timestamp: string;
}> = [];
const stagehand = await Stagehand.create({
browser: await browserbase.launch({ apiKey: process.env.BROWSERBASE_API_KEY }),
logging: {
level: "debug",
format: "json",
onLog(log) {
history.push({ ...log, timestamp: new Date().toISOString() });
},
},
});
// ... run your automation
// Inspect what happened, or write it to disk alongside the metrics
console.log(history.filter((entry) => entry.level === "error"));
console.log(await stagehand.metrics());
```
```python theme={null}
import os
from datetime import datetime, timezone
from stagehand import Stagehand, StagehandClientLoggingConfig, browserbase
history: list[dict] = []
def record(log) -> None:
entry = log.model_dump(mode="json")
entry["timestamp"] = datetime.now(timezone.utc).isoformat()
history.append(entry)
browser = await browserbase.launch(api_key=os.environ["BROWSERBASE_API_KEY"])
stagehand = await Stagehand.create(
browser=browser,
logging=StagehandClientLoggingConfig(level="debug", format="json", on_log=record),
)
# ... run your automation
# Inspect what happened, or write it to disk alongside the metrics
print([entry for entry in history if entry["level"] == "error"])
print(await stagehand.metrics())
```
```go theme={null}
var history []stagehand.StagehandLog
var mu sync.Mutex
apiKey := os.Getenv("BROWSERBASE_API_KEY")
browser, err := stagehand.LaunchBrowserbase(ctx, stagehand.BrowserbaseLaunchOptions{
APIKey: apiKey,
})
if err != nil {
return err
}
client, err := stagehand.Create(ctx, stagehand.CreateOptions{
Browser: browser,
Logging: &stagehand.StagehandClientLoggingConfig{
Level: stagehand.StagehandClientLogLevelDebug,
Format: stagehand.StagehandClientLogFormatJSON,
OnLog: func(entry stagehand.StagehandLog) {
mu.Lock()
history = append(history, entry)
mu.Unlock()
},
},
})
if err != nil {
return err
}
// ... run your automation
// Inspect what happened, or write it to disk alongside the metrics.
// Copy under the mutex: the callback runs on the notification goroutine, so
// ranging over `history` directly would race with an incoming log.
mu.Lock()
captured := make([]stagehand.StagehandLog, len(history))
copy(captured, history)
mu.Unlock()
for _, entry := range captured {
if entry.Level == stagehand.StagehandLogLevelError {
fmt.Printf("%+v\n", entry)
}
}
metrics, err := client.Metrics(ctx)
if err != nil {
return err
}
fmt.Printf("%+v\n", metrics)
```
The records you capture depend on the level. Raise it to `debug` for the fullest timeline; the default is `info` and above.
On Browserbase, the session replay dashboard gives you the same timeline visually, including the network and console activity that never reaches a log callback.
### Tracing
Stagehand emits OpenTelemetry spans for every operation and for every log record, and propagates W3C trace context across the SDK and runtime boundary. Point it at your own OTLP collector to see full traces alongside the rest of your system.
```typescript theme={null}
const browser = await browserbase.launch({
apiKey: process.env.BROWSERBASE_API_KEY,
});
const stagehand = await Stagehand.create({
browser,
telemetry: {
traces: {
endpoint: "https://otlp.example.com/v1/traces",
headers: { authorization: `Bearer ${process.env.OTLP_TOKEN}` },
},
},
});
```
```python theme={null}
import os
from stagehand import Stagehand, TelemetryConfig, browserbase
browser = await browserbase.launch(
api_key=os.environ["BROWSERBASE_API_KEY"],
)
stagehand = await Stagehand.create(
browser=browser,
telemetry=TelemetryConfig.model_validate({
"traces": {
"endpoint": "https://otlp.example.com/v1/traces",
"headers": {"authorization": f"Bearer {os.environ['OTLP_TOKEN']}"},
}
}),
)
```
```go theme={null}
apiKey := os.Getenv("BROWSERBASE_API_KEY")
browser, err := stagehand.LaunchBrowserbase(ctx, stagehand.BrowserbaseLaunchOptions{APIKey: apiKey})
if err != nil {
return err
}
client, err := stagehand.Create(ctx, stagehand.CreateOptions{
Browser: browser,
Telemetry: stagehand.TelemetryConfig{
Traces: stagehand.TelemetryTraces{
Endpoint: "https://otlp.example.com/v1/traces",
Headers: stagehand.TelemetryTracesHeaders{
"authorization": "Bearer " + os.Getenv("OTLP_TOKEN"),
},
},
},
})
if err != nil {
return err
}
defer func() { err = errors.Join(err, client.Close(ctx)) }()
```
| Field | Description |
| -------- | ----------------------------------------------------------------- |
| endpoint | OTLP HTTP traces endpoint. Must end in `/v1/traces`. |
| headers | Headers sent with every export, typically an authorization token. |
Spans are tagged with a span type: `operation` spans wrap act, observe, and extract, and record exceptions and error status; `log` spans carry the structured data from each log record. Traces are sampled at 100%.
## Best practices
* Track session success rates and failure patterns
* Monitor resource usage and scaling requirements
* Set up automated alerting for critical failures
* Implement cost tracking across different environments
* Use session analytics to optimize automation workflows
* Compare Browserbase vs local execution times
* Monitor token usage and inference costs across models
* Track geographic performance differences
* Identify bottlenecks in automation workflows
* Optimize for cost-effectiveness and speed
* Track session distribution across regions
* Monitor concurrent session limits and scaling
* Analyze failure patterns and common error scenarios
* Use session recordings for root cause analysis
* Implement custom metadata for workflow categorization
* Integrate session APIs with monitoring dashboards
* Set up automated notifications for session failures
* Track SLA compliance and performance benchmarks
* Monitor resource costs and usage patterns
* Use analytics data for capacity planning and optimization
## Next steps
Cut token spend and latency by serving repeated act, observe, and extract calls from the server-side cache.
Configure logging levels, custom loggers, and file-based session logging.