Stagehand provides powerful observability features to help you monitor, track performance, and analyze your browser automation workflows. Focus on session monitoring, resource usage, and operational insights for both Browserbase and local environments.

Browserbase Session Monitoring

When running on Browserbase, you gain access to comprehensive cloud-based monitoring and session management through the Browserbase API and dashboard.
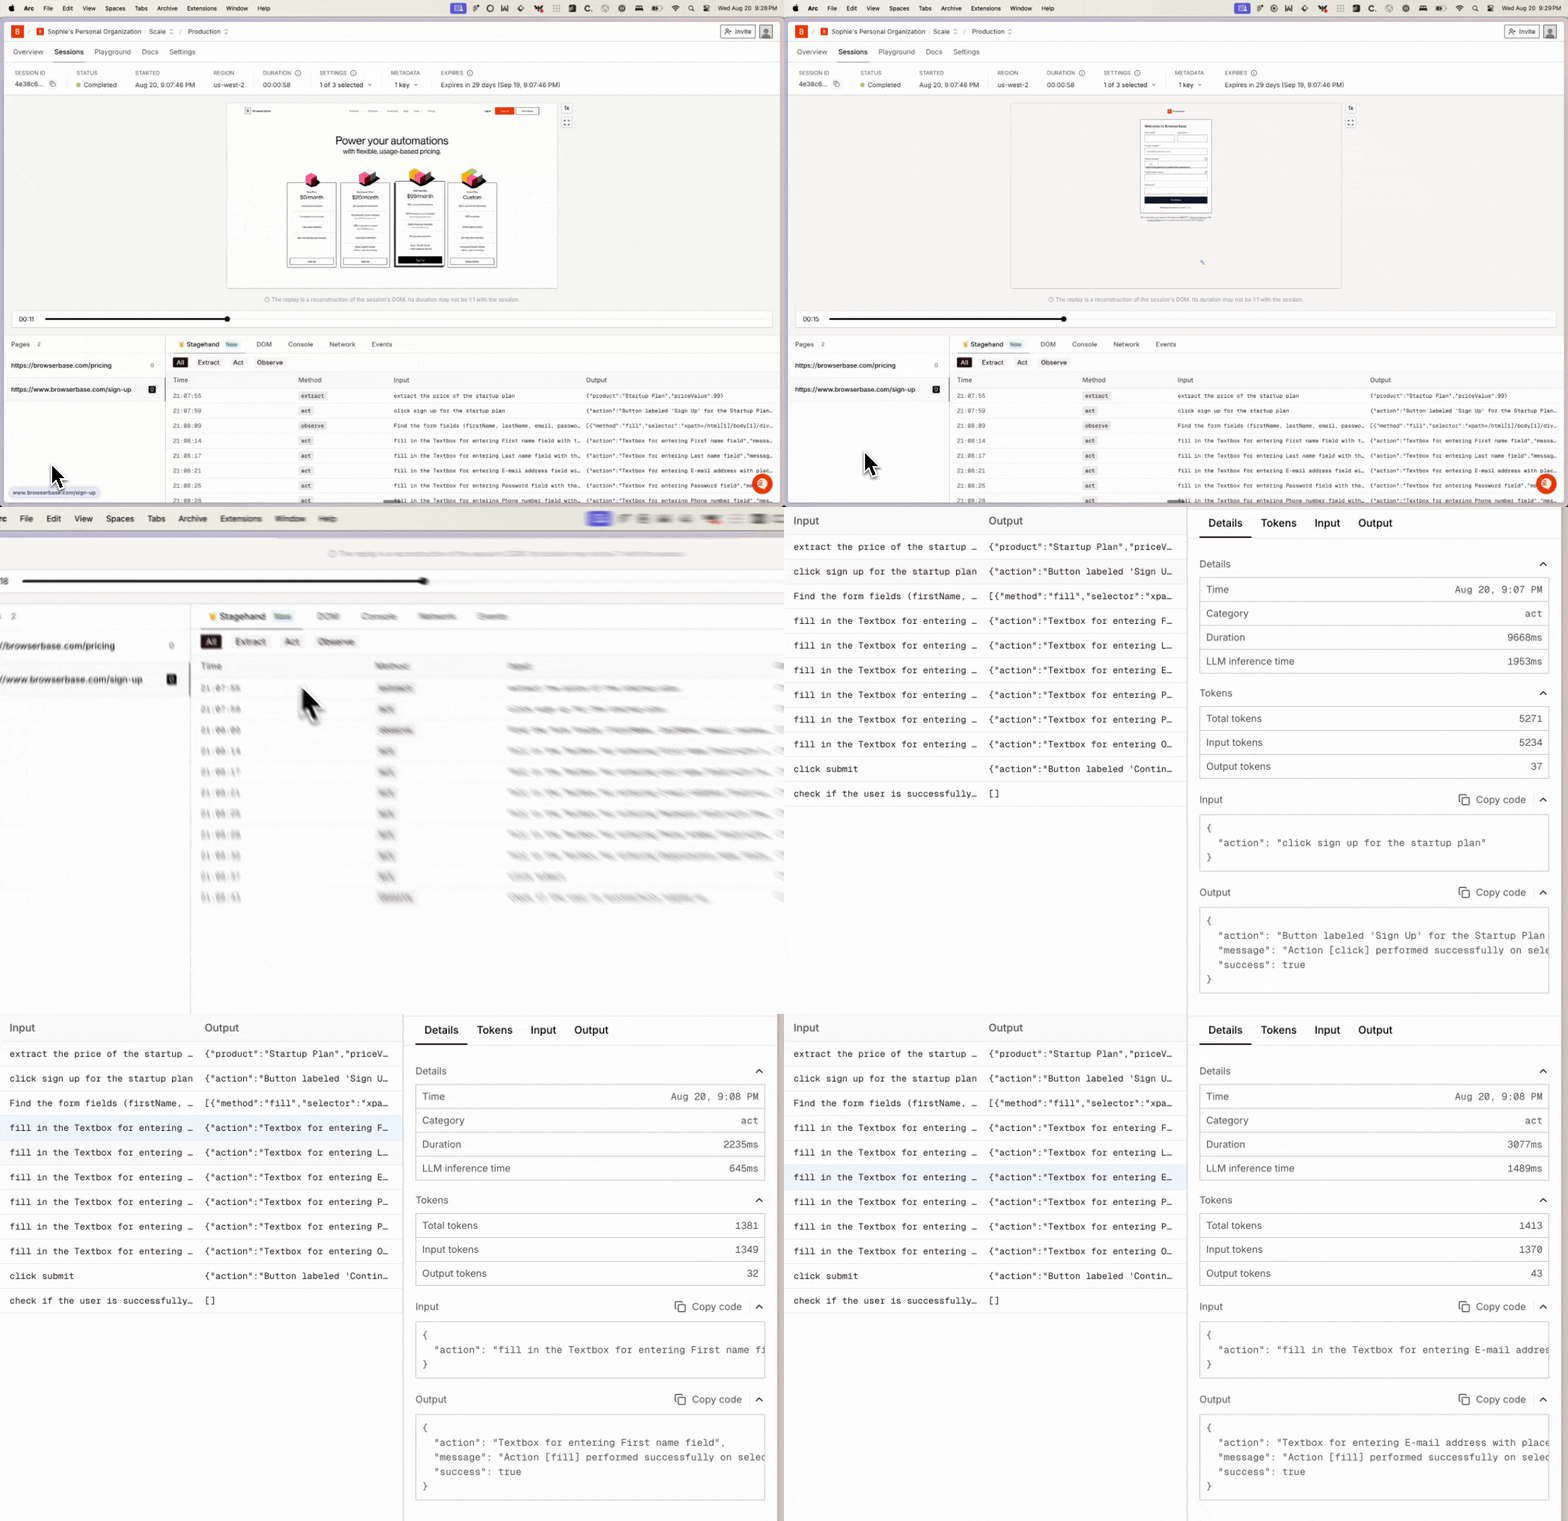
Browserbase Session Observability

Live Session Visibility

Browserbase provides real-time visibility into your automation sessions: Session Dashboard Features
  • Real-time browser screen recording and replay
  • Network request monitoring with detailed timing
  • JavaScript console logs and error tracking
  • CPU and memory usage metrics
  • Session status and duration tracking
Session Management & API Access
import { Stagehand } from "@browserbasehq/stagehand";
import { Browserbase } from "@browserbasehq/sdk";

const browserbase = new Browserbase({
  apiKey: process.env.BROWSERBASE_API_KEY,
});

const stagehand = new Stagehand({
  env: "BROWSERBASE"
});

await stagehand.init();

const sessionInfo = await browserbase.sessions.retrieve(stagehand.sessionId);

console.log("Session status:", sessionInfo.status);
console.log("Session region:", sessionInfo.region);
console.log("CPU usage:", sessionInfo.avgCpuUsage);
console.log("Memory usage:", sessionInfo.memoryUsage);
console.log("Proxy bytes:", sessionInfo.proxyBytes);

Session Analytics & Insights

Real-Time Monitoring

Monitor live session status, resource usage, and geographic distribution. Scale and manage concurrent sessions with real-time insights.

Session Recordings

Review complete session recordings with frame-by-frame playback. Analyze network requests and debug browser interactions visually.

API Management

Programmatically access session data, automate lifecycle management, and integrate with monitoring systems through our API.

Usage Monitoring

Track resource consumption, session duration, and API usage. Get detailed breakdowns of costs and utilization across your automation.

Session Monitoring & Filtering

Query and monitor sessions by status and metadata:
import { Browserbase } from "@browserbasehq/sdk";

const browserbase = new Browserbase({
  apiKey: process.env.BROWSERBASE_API_KEY,
});

// List sessions with filtering
async function getFilteredSessions() {
  const sessions = await browserbase.sessions.list({
    status: 'RUNNING'
  });
  
  return sessions.map(session => ({
    id: session.id,
    status: session.status, // RUNNING, COMPLETED, ERROR, TIMED_OUT
    startedAt: session.startedAt,
    endedAt: session.endedAt,
    region: session.region,
    avgCpuUsage: session.avgCpuUsage,
    memoryUsage: session.memoryUsage,
    proxyBytes: session.proxyBytes,
    userMetadata: session.userMetadata
  }));
}

// Query sessions by metadata
async function querySessionsByMetadata(query: string) {
  const sessions = await browserbase.sessions.list({
    q: query
  });
  
  return sessions;
}

Local Environment Monitoring

For local development, Stagehand provides performance monitoring and resource tracking capabilities directly on your machine.

Performance Tracking

import { Stagehand } from "@browserbasehq/stagehand";

const stagehand = new Stagehand({
  env: "LOCAL",
  verbose: 1, // Monitor performance without debug noise
});

// Track local automation metrics
const startTime = Date.now();
const initialMetrics = stagehand.metrics;

// ... perform automation tasks

const finalMetrics = stagehand.metrics;
const executionTime = Date.now() - startTime;

console.log('Local Performance Summary:', {
  executionTime: `${executionTime}ms`,
  totalTokens: finalMetrics.totalPromptTokens + finalMetrics.totalCompletionTokens,
  averageResponseTime: finalMetrics.totalInferenceTimeMs / 3, // Assuming 3 operations
  tokensPerSecond: (finalMetrics.totalPromptTokens + finalMetrics.totalCompletionTokens) / (executionTime / 1000)
});

Resource Usage Monitoring

When running locally, monitor system resource usage and browser performance:
import { Stagehand } from "@browserbasehq/stagehand";
import * as os from 'os';
import { performance } from 'perf_hooks';

class LocalResourceMonitor {
  private cpuUsage: number[] = [];
  private memoryUsage: number[] = [];
  
  startMonitoring() {
    const interval = setInterval(() => {
      // Track system resources
      const memUsage = process.memoryUsage();
      this.memoryUsage.push(memUsage.heapUsed / 1024 / 1024); // MB
      
      // Track CPU (simplified)
      const loadAvg = os.loadavg()[0];
      this.cpuUsage.push(loadAvg);
    }, 1000);
    
    return interval;
  }
  
  getResourceSummary() {
    return {
      avgMemoryUsage: this.memoryUsage.reduce((a, b) => a + b, 0) / this.memoryUsage.length,
      peakMemoryUsage: Math.max(...this.memoryUsage),
      avgCpuLoad: this.cpuUsage.reduce((a, b) => a + b, 0) / this.cpuUsage.length,
      totalDataPoints: this.cpuUsage.length
    };
  }
}

const monitor = new LocalResourceMonitor();
const interval = monitor.startMonitoring();

const stagehand = new Stagehand({ env: "LOCAL" });

// ... run automation

clearInterval(interval);
console.log('Resource Usage:', monitor.getResourceSummary());

LLM Usage

Monitor token usage, costs, and speed. Set up automated alerting for critical failures. Implement cost tracking across different environments. Use session analytics to optimize automation workflows.

Real-Time Metrics & Monitoring

Basic Usage Tracking

Monitor your automation’s resource usage in real-time with stagehand.metrics:
// Get current metrics
console.log(stagehand.metrics);

// Monitor during automation
const startTime = Date.now();
const initialMetrics = stagehand.metrics;

// ... perform automation tasks

const finalMetrics = stagehand.metrics;
const executionTime = Date.now() - startTime;

console.log('Automation Summary:', {
  totalTokens: finalMetrics.totalPromptTokens + finalMetrics.totalCompletionTokens,
  totalCost: calculateCost(finalMetrics),
  executionTime,
  efficiency: (finalMetrics.totalPromptTokens + finalMetrics.totalCompletionTokens) / executionTime
});

Understanding Metrics Data

The metrics object provides detailed breakdown by Stagehand operation:
{
  actPromptTokens: 4011,
  actCompletionTokens: 51,
  actInferenceTimeMs: 1688,

  extractPromptTokens: 4200,
  extractCompletionTokens: 243,
  extractInferenceTimeMs: 4297,

  observePromptTokens: 347,
  observeCompletionTokens: 43,
  observeInferenceTimeMs: 903,

  totalPromptTokens: 8558,
  totalCompletionTokens: 337,
  totalInferenceTimeMs: 6888
}

Log Inference to File

You can also log inference to a file by setting logInferenceToFile to true. This will create a directory called inference_summary in your project’s root directory.
const stagehand = new Stagehand({
  logInferenceToFile: true,    
});
The inference_summary directory provides granular analysis data:
inference_summary/
├── act_summary/
│   ├── {timestamp}.json
│   └── ...
│   └── act_summary.json
├── extract_summary/
│   ├── {timestamp}.json
│   └── ...
│   └── extract_summary.json
├── observe_summary/
│   ├── {timestamp}.json
│   └── ...
│   └── observe_summary.json

Log File Structure

Each operation creates detailed logs for analysis:
{
  "act_summary": [
    {
      "act_inference_type": "act",
      "timestamp": "20250329_080446068",
      "LLM_input_file": "20250329_080446068_act_call.txt",
      "LLM_output_file": "20250329_080447019_act_response.txt",
      "prompt_tokens": 3451,
      "completion_tokens": 45,
      "inference_time_ms": 951
    },
    ...
  ],
}

Best Practices

For detailed logging and debugging capabilities, see Logging.